The algorithms.
The workspace.
Explore a sliding collage of actual product views: Terrain Core, Expansion and Vector, Session Scenarios, market states and chart research. Use the controls or swipe to explore; select a capture to inspect it at full size.
Proprietary research. Visible on the chart.
Terrain Core · TSLA · Daily
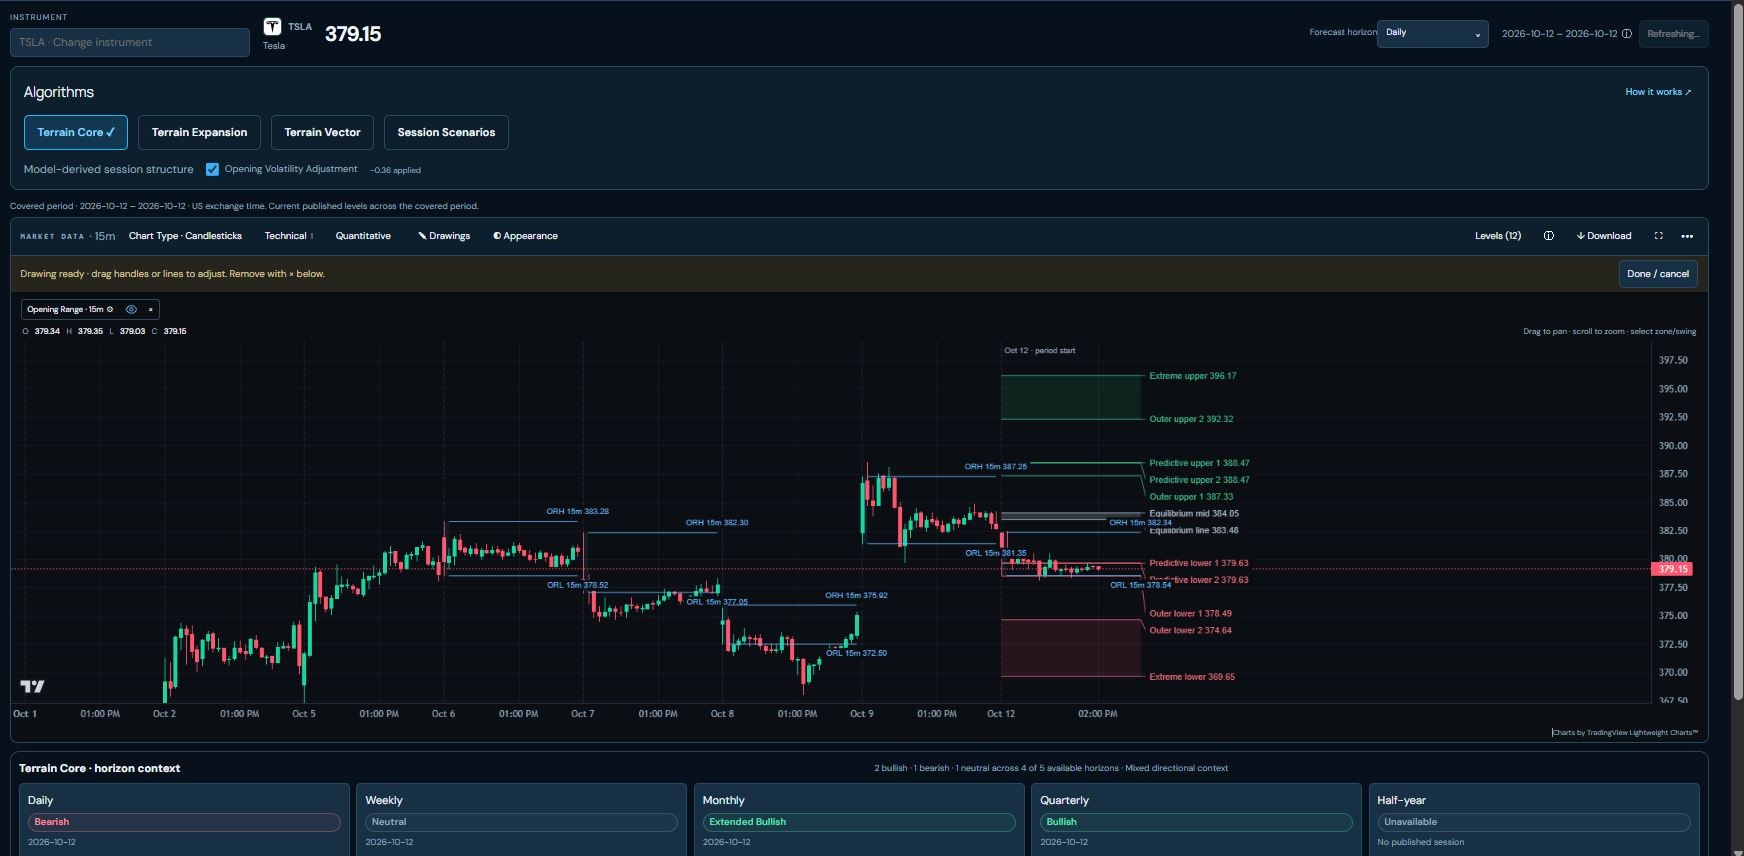

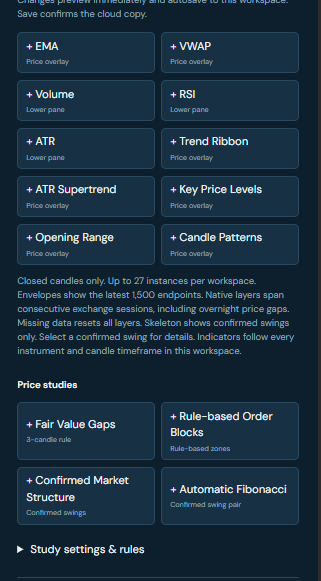
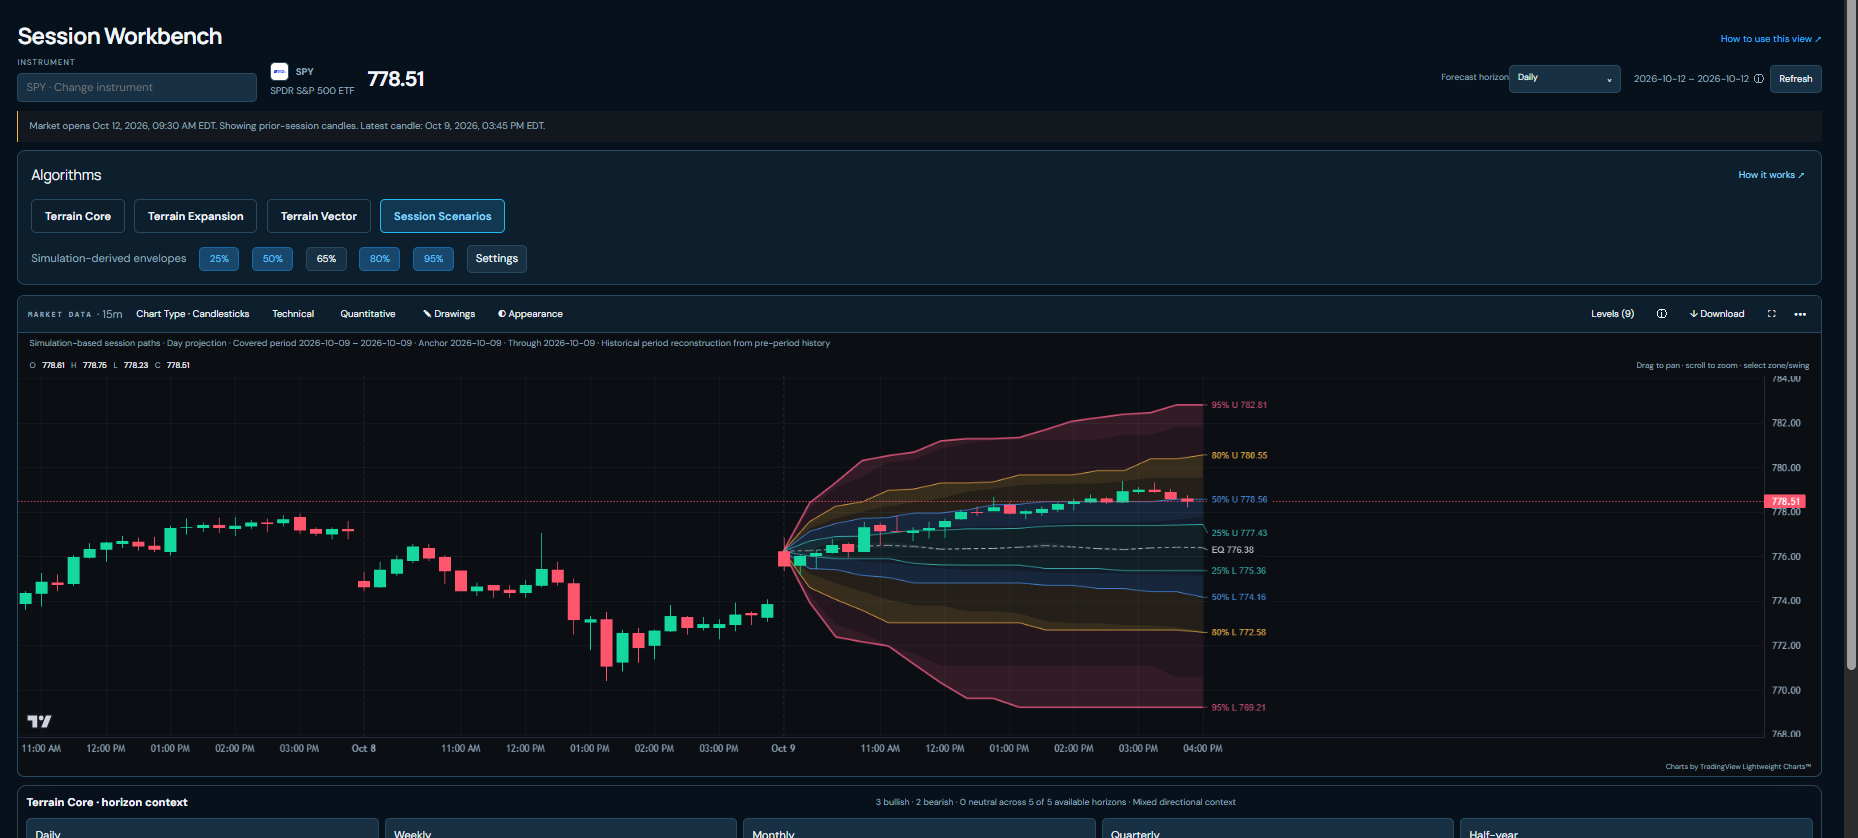
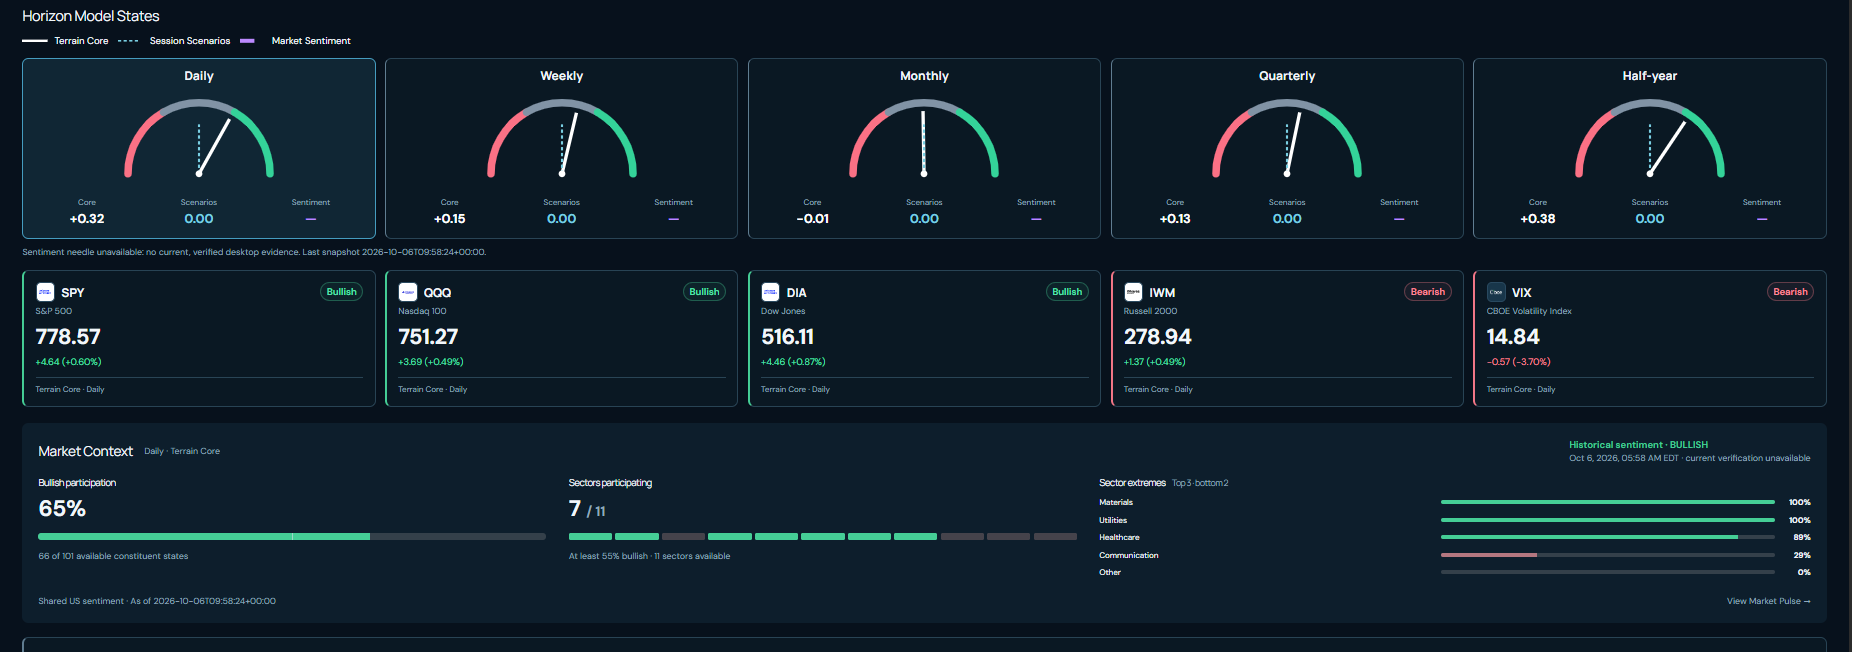
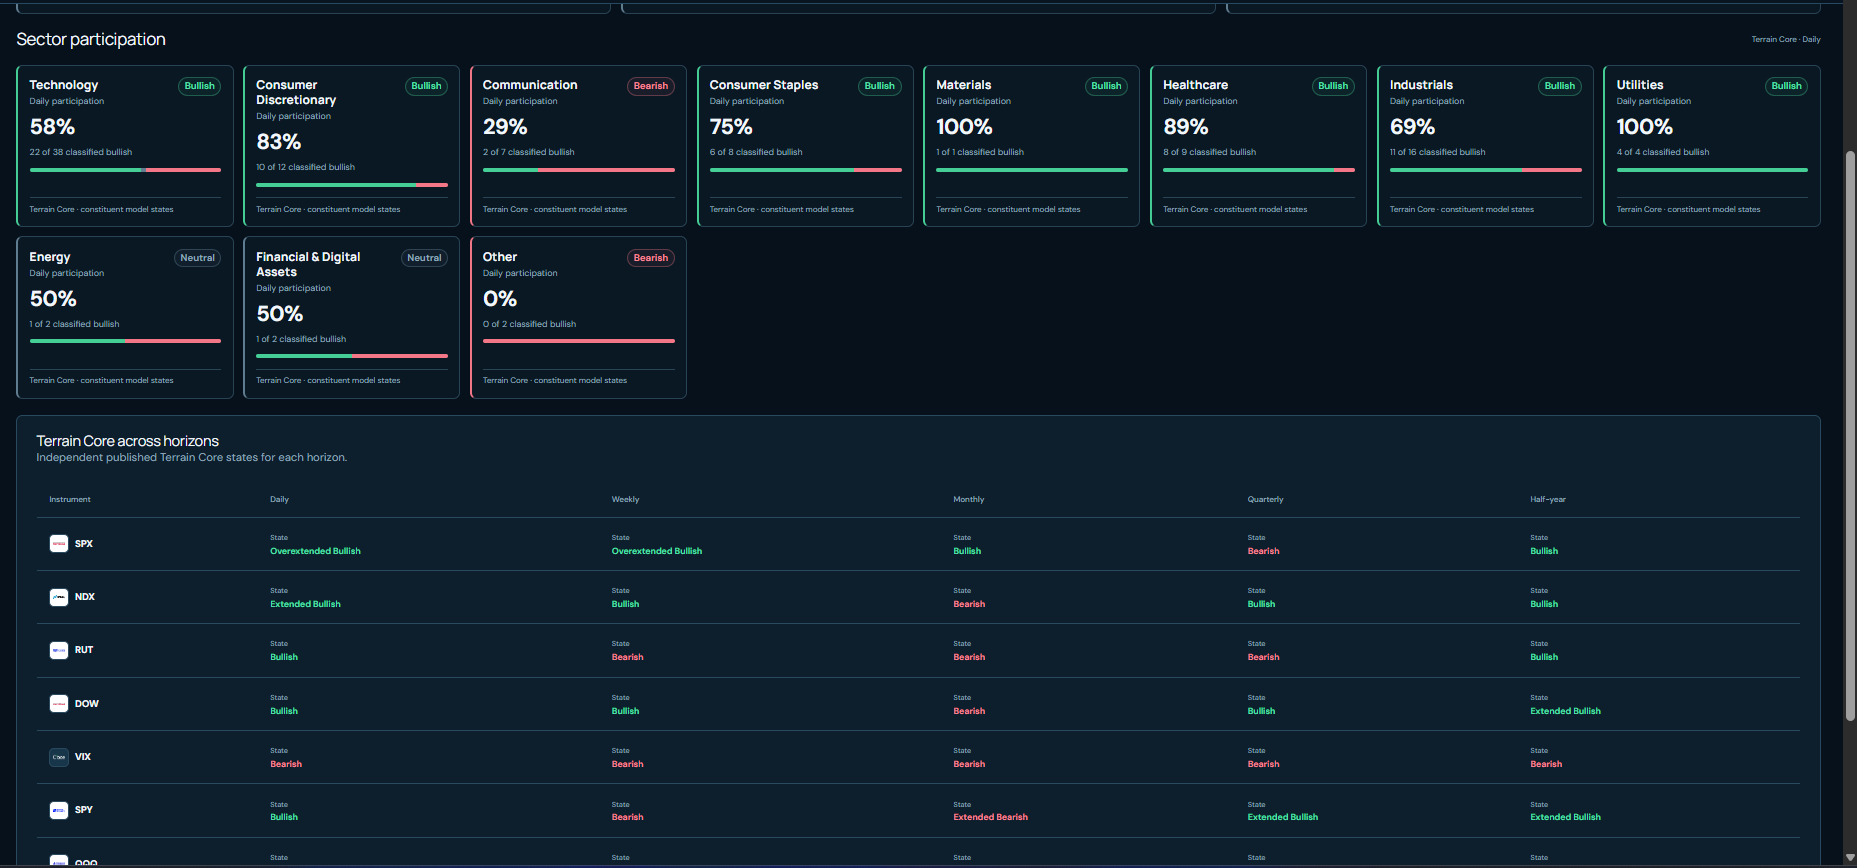
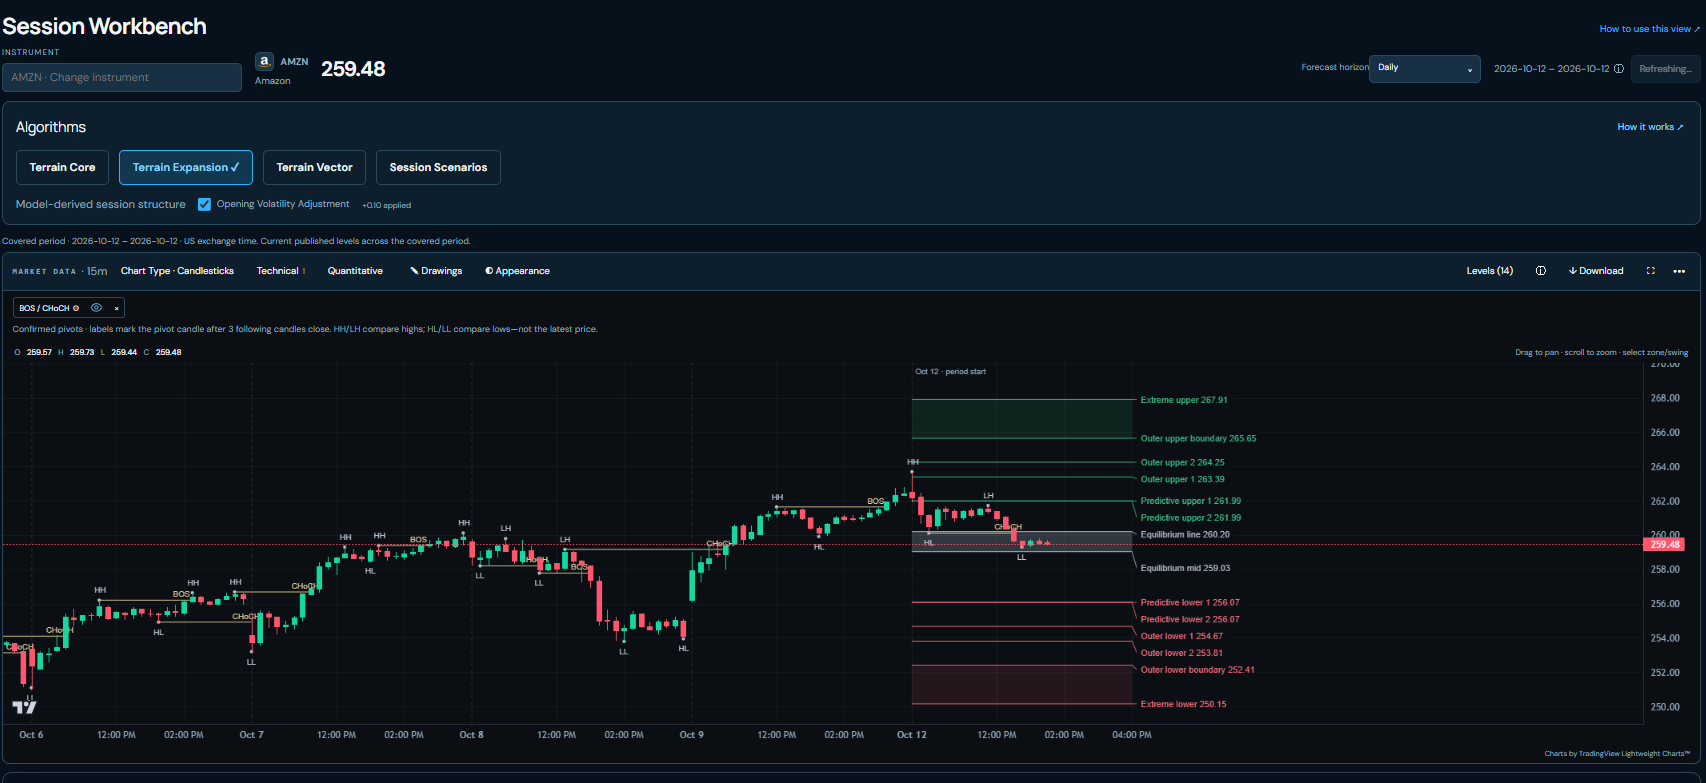
User-provided product capture · TSLA / Terrain Core / Daily · 12 October 2026 · Opening Volatility Adjustment enabled. Fixed snapshot, not live data.
Machine-learning ranges and quantitative context, with assumptions explained.
Licensed candles where supported; index and ETF references are clearly distinguished.
Shared market-data updates complement forecasts refreshed by the research pipeline.
Coverage gaps and last-available sessions remain visible in the workspace. Ranges are not guarantees.
How to use the workspace
01 / Choose an algorithm
Choose Core, Expansion or Vector to inspect different views of the published session structure.
02 / Compare the market
Inspect sector participation and leadership, including instrument coverage and weights.
03 / Research on the chart
Use Session Scenarios, Key Levels and chart studies together. Check forecast periods, candle dates and assumptions.