01 / RESEARCH TOOLSST ↗
Key Levels
Locate equilibrium, support and resistance.
PRICE / LEVEL CONTEXTILLUSTRATIVE
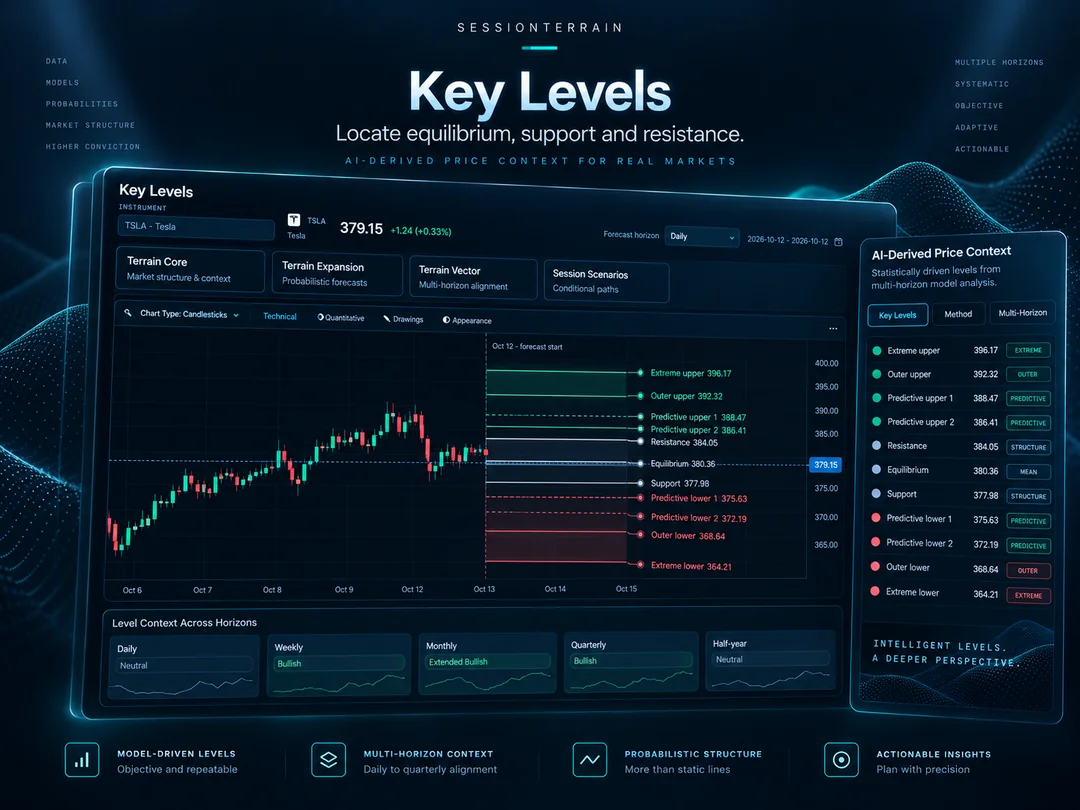
TSLA EXAMPLE MULTI-HORIZON
AI-powered forecast bands, session scenarios, key levels and market structure in one research workspace. Built for traders who want clearer context, not noisy signals.
Locate equilibrium, support and resistance.
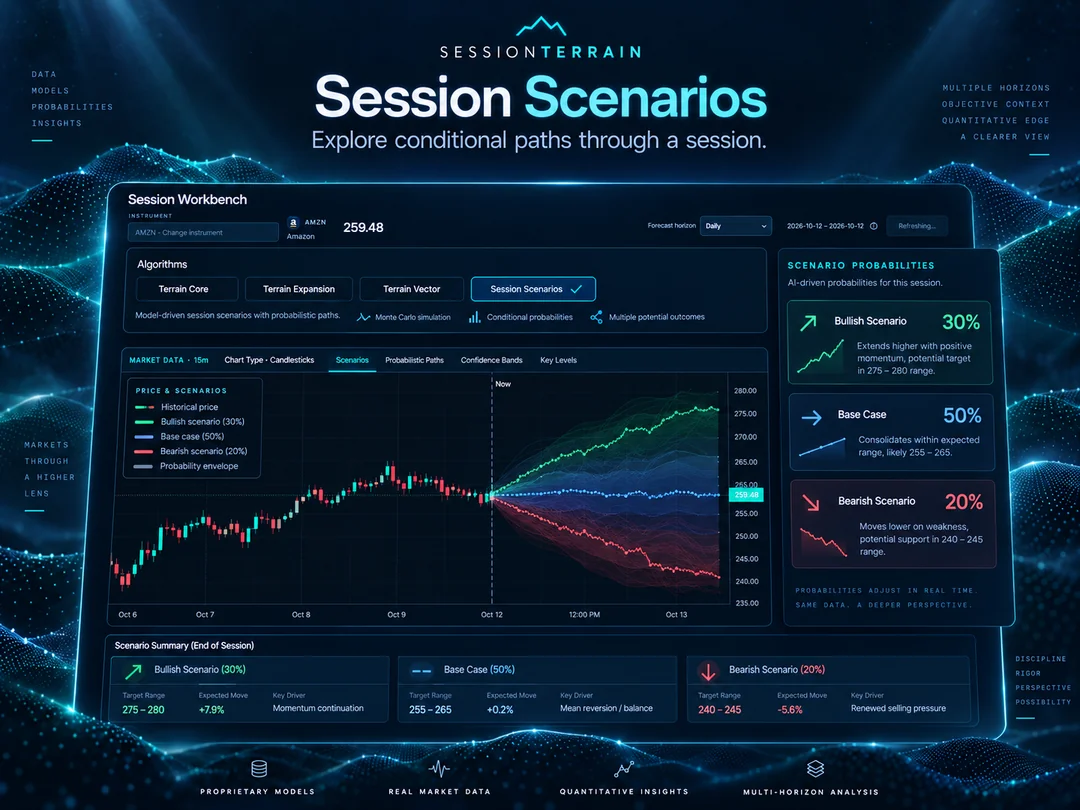
Explore conditional paths through a session.
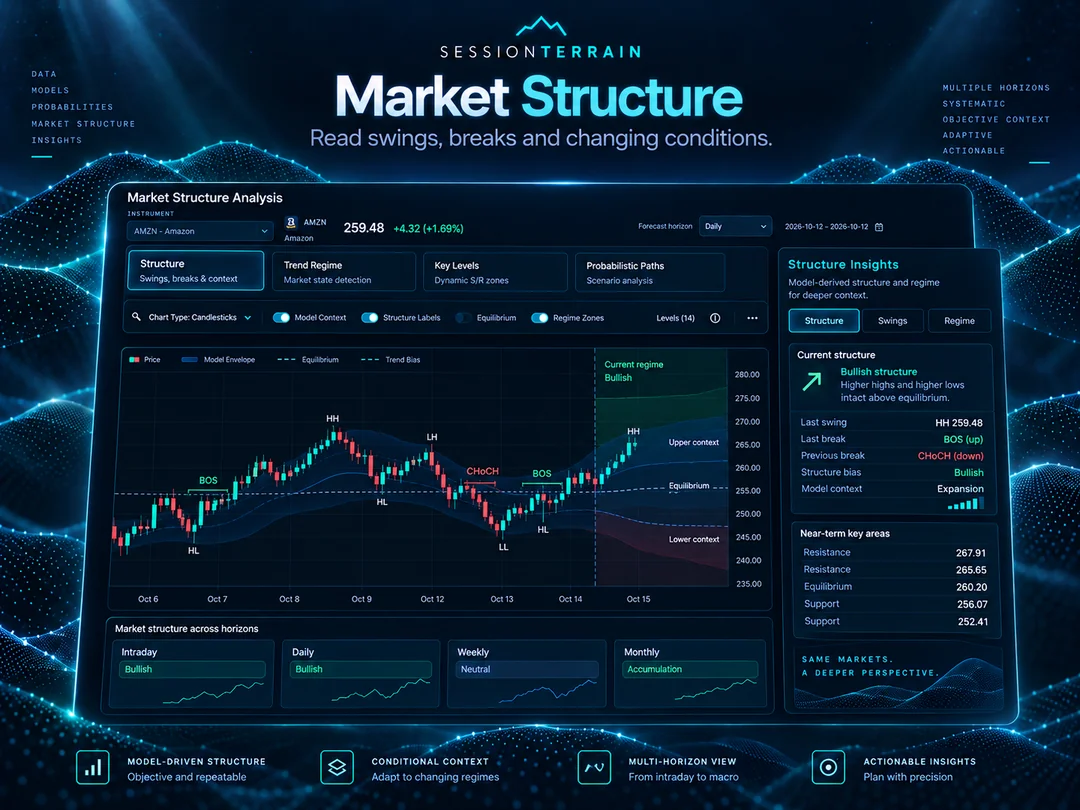
Read swings, breaks and changing conditions.
Locate equilibrium, support and resistance.
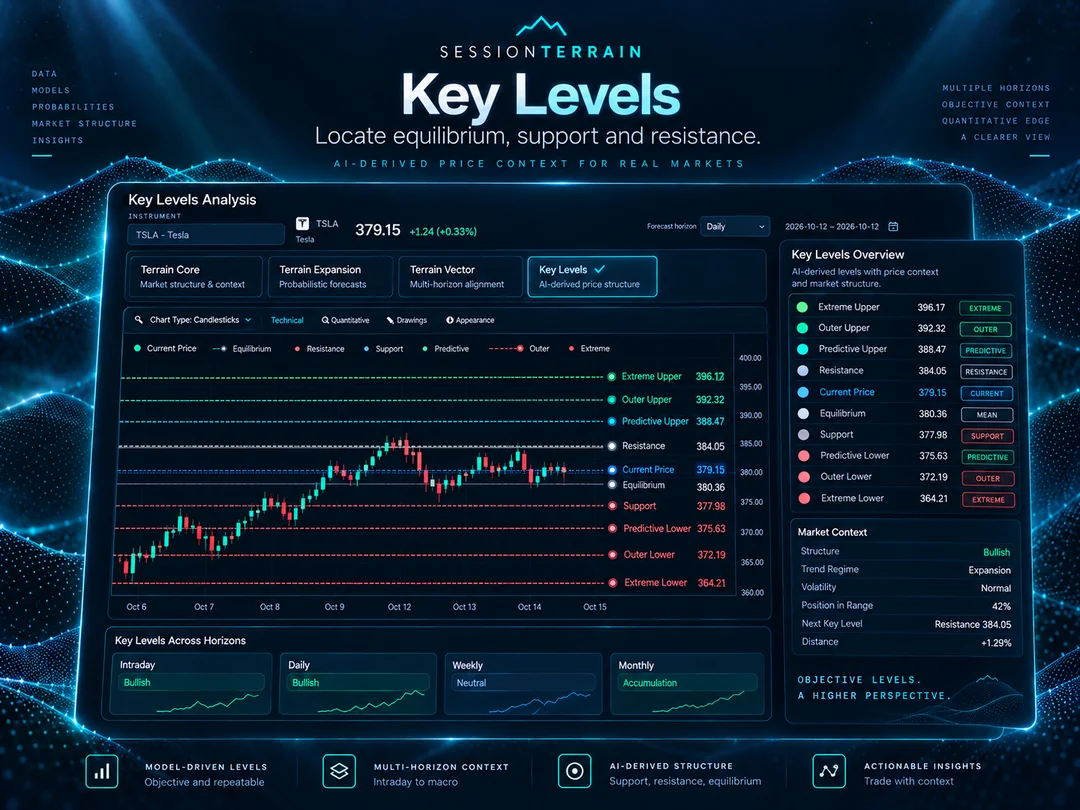
AI price structure with real market context.
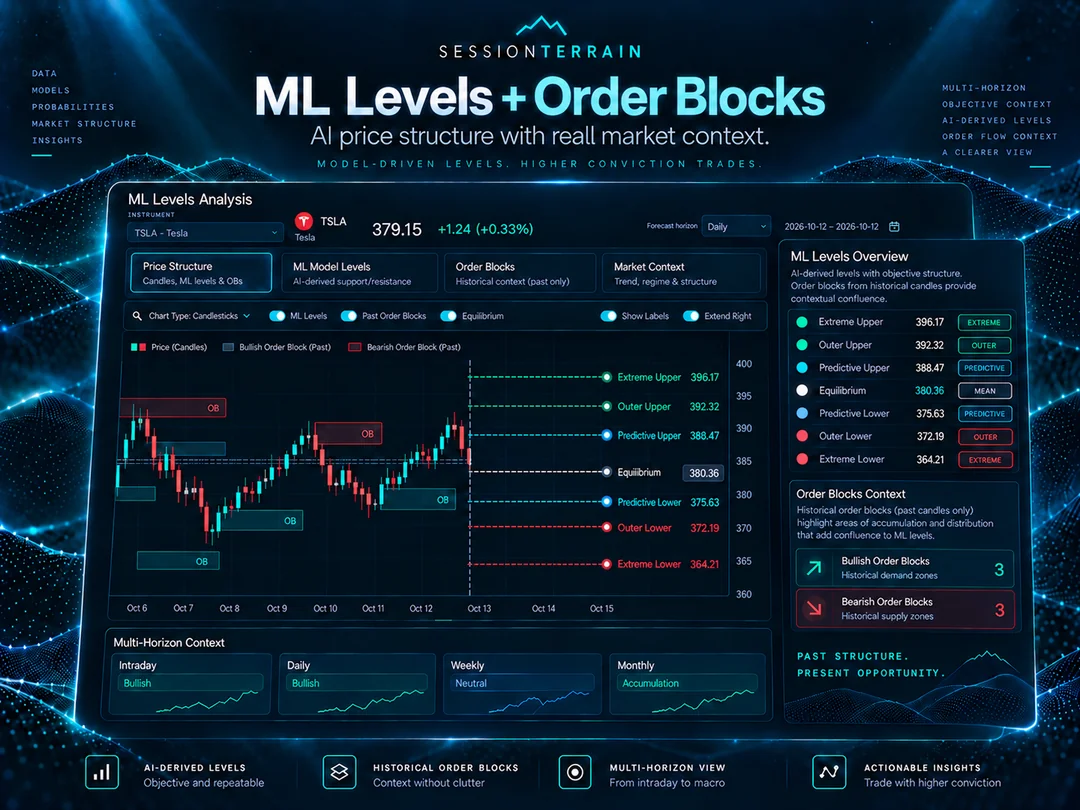
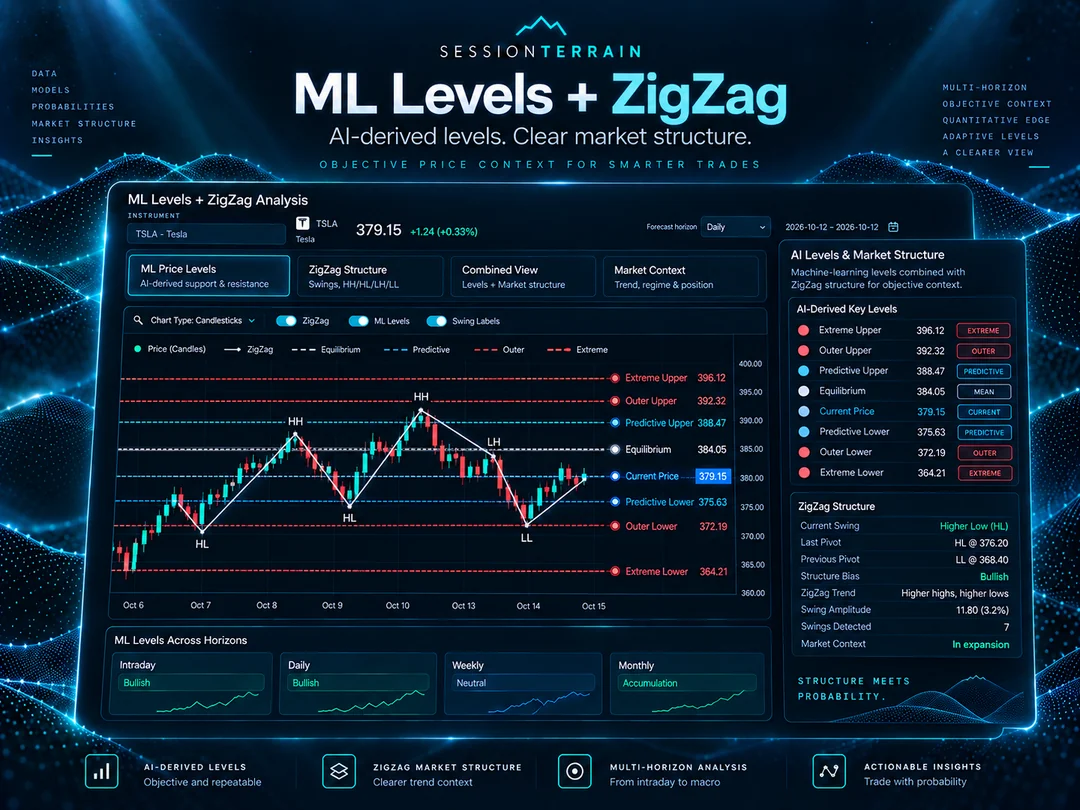
AI-derived levels. Clear market structure.
Compare model states across horizons.
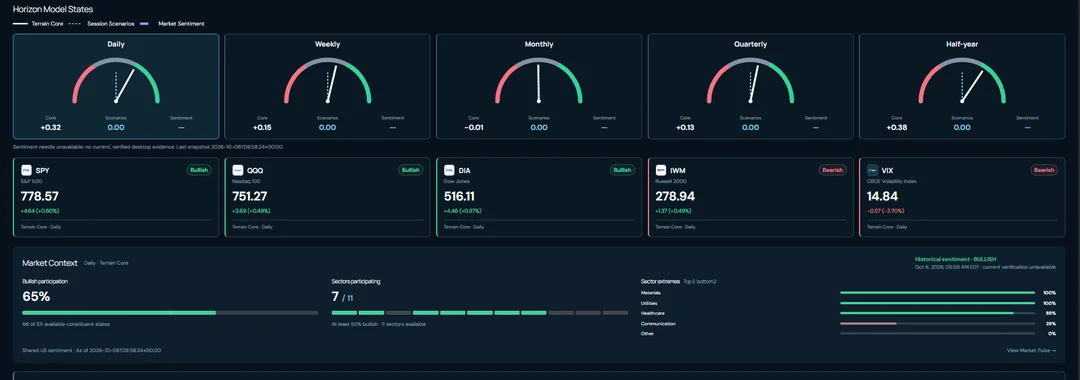
Illustrative product views · not live market data. Forecasts and scenarios are conditional estimates.
Our machine-learning and quantitative forecasting framework produces the session structure. Core, Expansion and Vector offer three ways to inspect it; Session Scenarios adds simulation-derived envelopes.
The published session structure: forecast ranges, equilibrium and model states across horizons.
A wider extension structure for inspecting the outer ranges around the session.
Denser intermediate structure for a more detailed view of the model-derived levels.
Simulation-derived envelopes for exploring how conditional ranges develop through a session.
Explore the algorithm suite in the sample ↗See how the algorithms fit together ↗
Choose an instrument and a forecast horizon. Inspect the model’s levels, compare the wider market and test your reading against alternative scenarios.
See observed candles alongside equilibrium, upper and lower forecast levels. Compare Terrain Core, Expansion and Vector for your selected stock, index or ETF.
See a forecast-level chart ↗See how many covered stocks have bullish model states, which sectors participate and where states agree or differ across daily, weekly and longer horizons.
Inspect market participation ↗Compare simulation-derived envelopes with observed candles. Add Key Levels, EMA, VWAP, market structure or Fibonacci to inspect the chart in more detail.
See Session Scenarios ↗Forecast levels and scenario ranges are estimates, not guarantees. Check the forecast period and candle dates before interpreting a chart.
Methodology and limitations ↗Explore the public sample without an account, or start a 7-day Core trial. No credit card required.