Read the charts.
Understand the context.
Our proprietary machine-learning and quantitative framework brings price ranges, scenario context and market structure into one workspace for independent traders. The algorithms and implementation remain proprietary; source dates, analytical context and limitations stay visible.
Three views. Three questions.
Use these actual public product captures to follow the explanation. These product previews are not streaming market readings. Open a full-size image to inspect its labels.
Open full-size chart image ↗ (new tab)
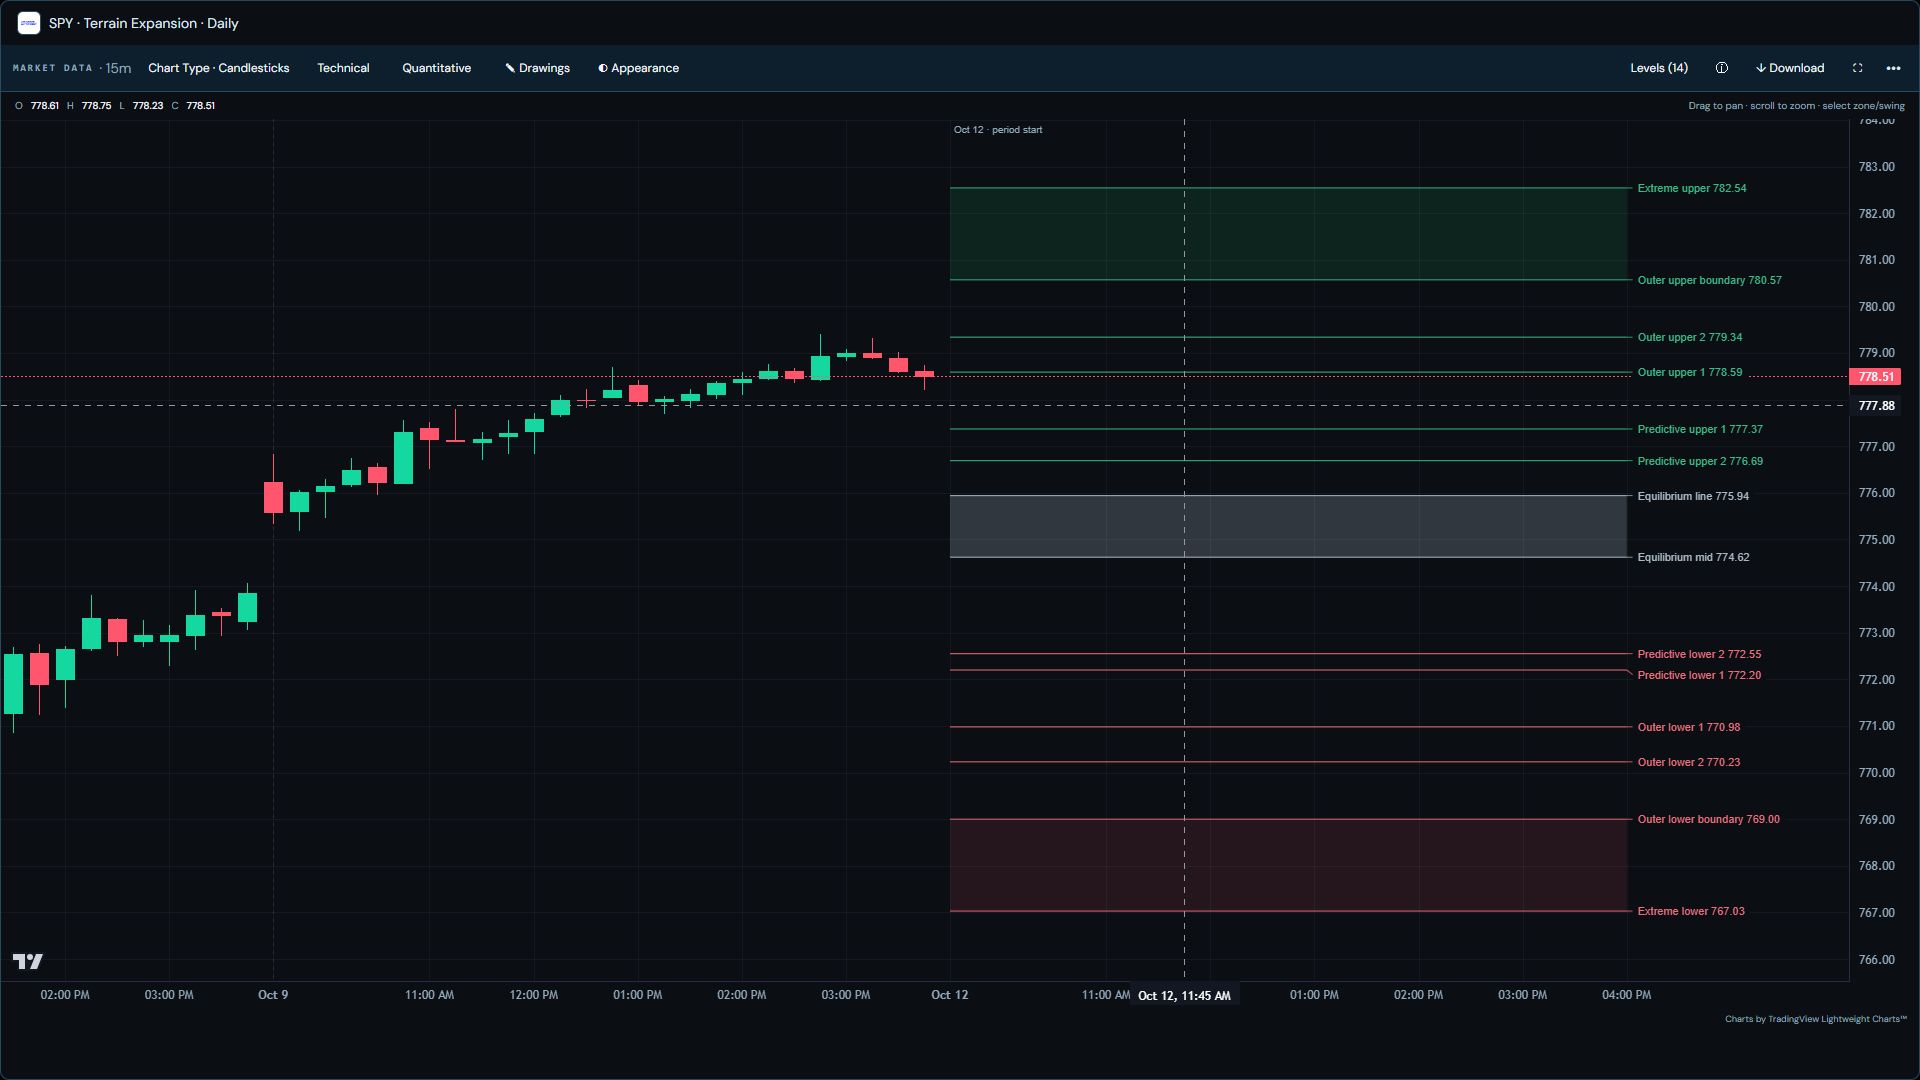
Workbench: price and forecast levels
Identify the instrument. This capture shows SPY, an ETF reference for the S&P 500.
Read the structure. Compare predictive ranges, outer levels and equilibrium with observed candles.
Check the dates. Forecast periods and observed candle dates can differ.
Forecast ranges are conditional estimates, not guarantees.
Explore price structure →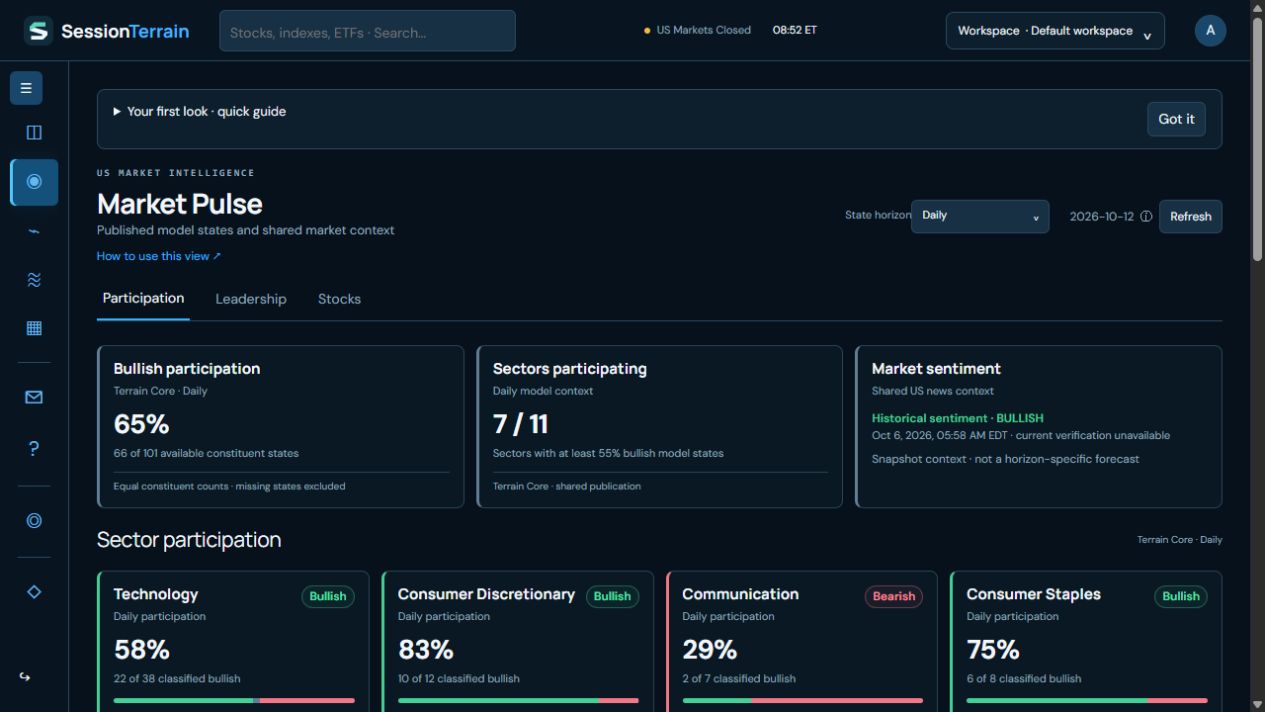
Open full-size chart image ↗ (new tab)
Market Pulse: inspect participation
Start with coverage. Participation counts include available constituent states; missing states are excluded.
Inspect the sectors. Compare the proportion of bullish model states across sectors.
Separate the readings. The sentiment snapshot has its own observation date and verification status.
Participation is an observation, not a probability of the next market move.
Explore market breadth →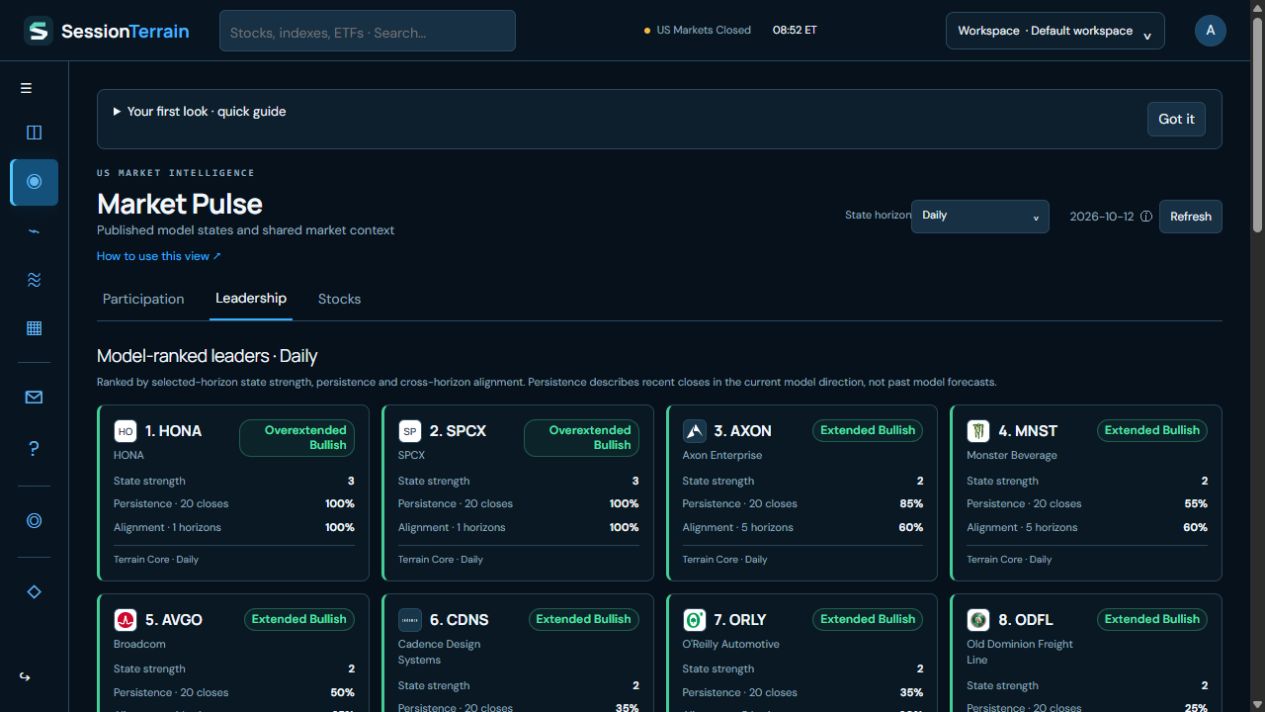
Open full-size chart image ↗ (new tab)
Leadership: compare the evidence
Read state strength. Compare the model state attached to each ranked instrument.
Check persistence. Persistence describes recent closes in the current model direction, not past model forecasts.
Compare alignment. Inspect agreement across the available horizons.
Rankings do not establish future performance or provide investment advice.
Explore market leadership →Ranked Market Leadership and 3D Leadership Dynamics
The ranked cards compare model-state strength, recent closes in the current model direction, and alignment across horizons. The separate 3D view explores historical influence within a selected group. Its height is normalized influence, not model-state strength.
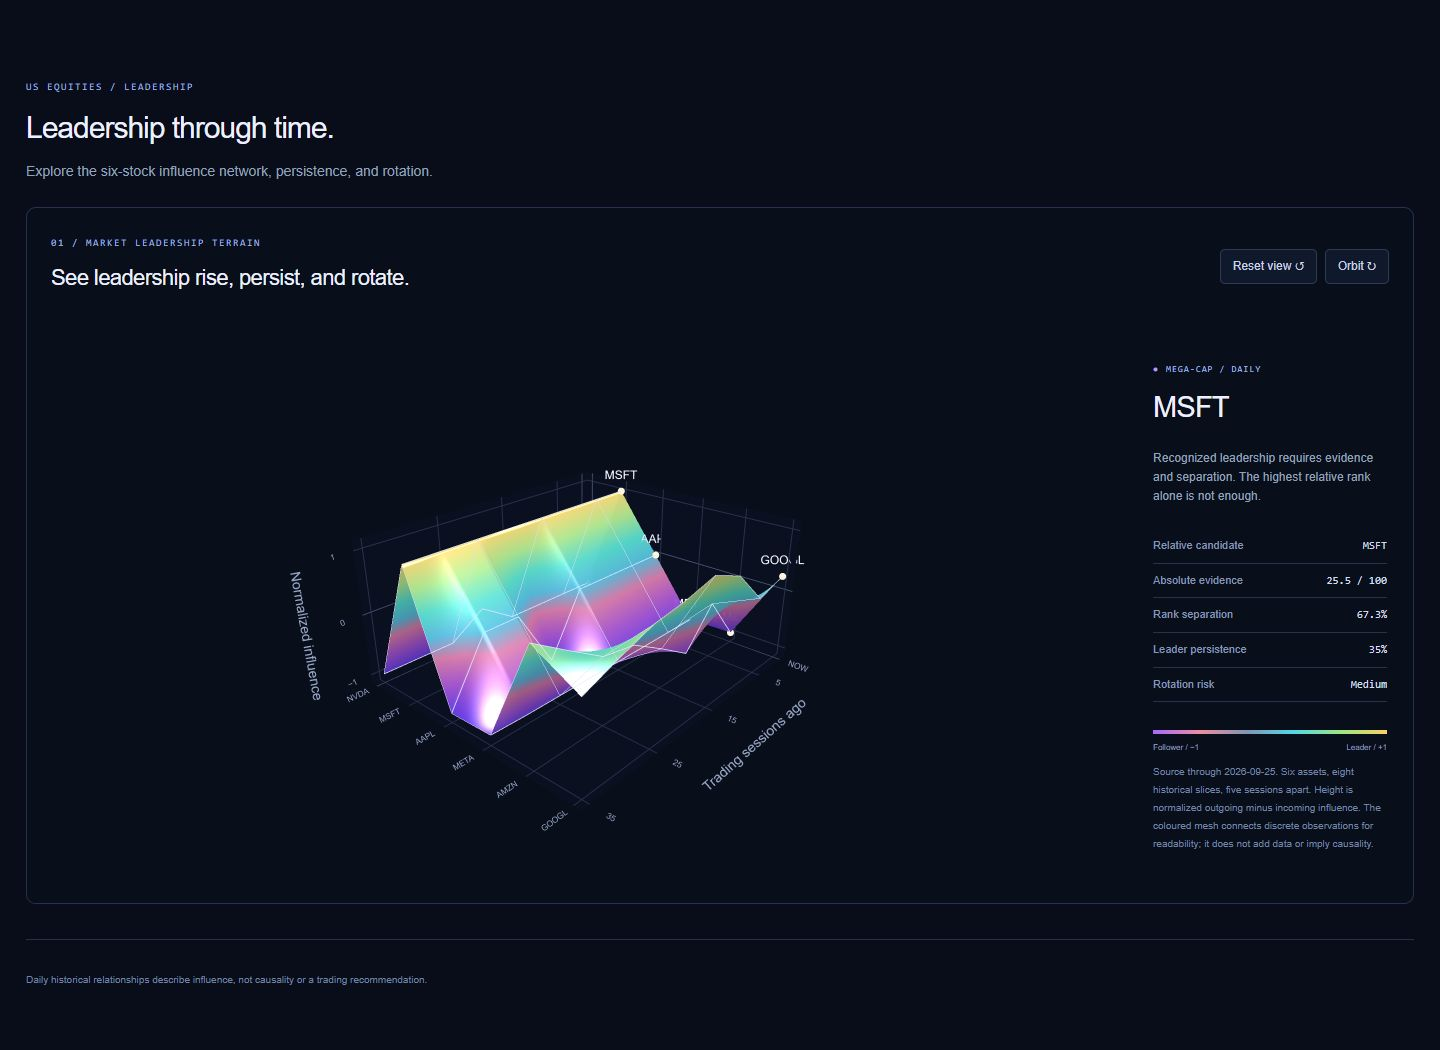
Open ranked leadership and 3D dynamics in Market Pulse ↗
Both views require Pro access. In the Leadership tab, the 3D group view follows the ranked cards.
Scope and research standards
Machine-learning ranges and quantitative context, with assumptions explained.
Licensed candles where supported; index and ETF references are clearly distinguished.
Shared market-data updates complement forecasts refreshed by the research pipeline.
Coverage gaps and last-available sessions remain visible in the workspace. Ranges are not guarantees.
Source transparency
The authenticated workspace identifies each forecast horizon, source context and publication status. Observed Finazon candles and forecast levels share an index chart where the entitlement supports the instrument. Cash indexes and ETF references remain distinct.
Data coverage
Licensed candle coverage is checked against the entitled provider catalog. Missing identifiers or data remain explicitly unavailable. Public previews illustrate the product; exact model training windows and calibration details are not published here.
What the analysis shows
Price structure places observed prices alongside estimated reference ranges. Scenario views add context around possible market conditions. Market state and breadth show how participation is distributed, while leadership ranks covered instruments by state strength, persistence and alignment across horizons; a separate historical terrain view shows how influence among six mega-cap stocks has changed over time.
Update cadence
A shared collector refreshes available market data within provider limits. Forecast levels update through the research publication pipeline. Closed markets and temporary feed failures retain last-valid observations, while the workspace separately identifies last-available forecast sessions.
Validation: what is and is not established
Existing checks cover retained calculation parity, market sessions, data integrity, leadership equations and publication handling. These engineering checks are not evidence of profitable trades or calibrated forecast coverage. A bar-by-bar comparison of leadership output with the original TradingView indicator remains pending.
No out-of-sample performance study is presented on this site. A research evaluation would need time-ordered holdouts, leakage controls, horizon-specific calibration checks and comparisons across market regimes before supporting an accuracy claim.
Universes and aggregation
Breadth dials retain the original cockpit universe and weights, including index and ETF references. The overview uses stock-only counts. The historical leadership terrain covers six mega-cap stocks, while the ranked leadership view covers the published stock universe. Differences between those views are not automatically disagreements about the same population.
Limitations
Historical relationships may change. Data quality, revisions, feed alignment and model assumptions affect the outputs. Scenarios and ranges are conditional estimates, not guaranteed containment, price targets or trading signals. A fixed reference map is not a historical prediction record. Missing data is unavailable, not neutral.
The framework supports independent analysis; it does not replace risk management or provide personalized financial advice.