How SessionTerrain works
Research US stocks and indexes in one quantitative workspace: understand the market, explore the forecast, then research scenarios on the chart.
Start with Market Pulse.
Then look beneath it.
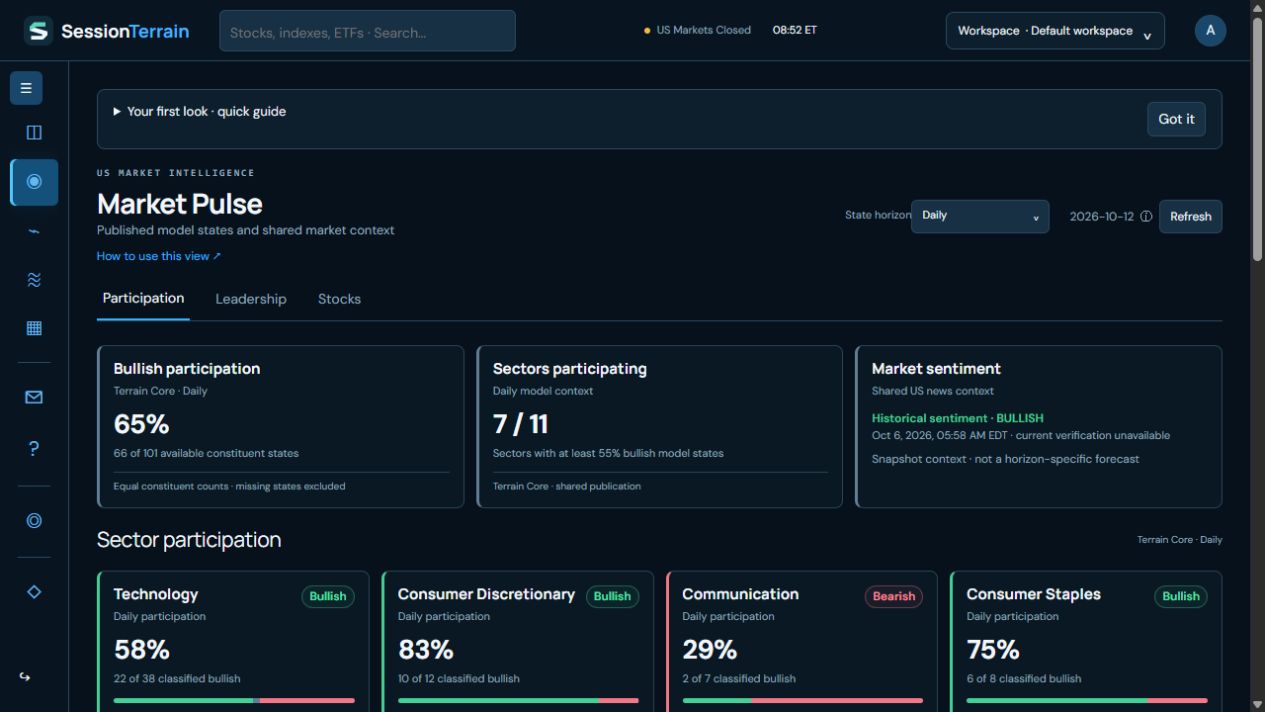
Compare published market states across daily, weekly, monthly, quarterly and half-year horizons. Market Pulse brings bullish participation, sector model states, index conditions and ranked leadership into one view, each reading shown with its observation date and coverage.
Open Market Pulse participation ↗
Breadth and participation
See how many covered constituents hold bullish model states and which sectors agree. Equal constituent counts exclude constituents without a published state.
Leadership
Read the ranked instruments by state strength, persistence and alignment across horizons. Persistence describes recent closes in the current model direction, not past forecasts.
Coverage
Every reading identifies its horizon, observation date and available coverage. A missing reading stays unavailable rather than appearing neutral.
Read the forecast
around observed price.
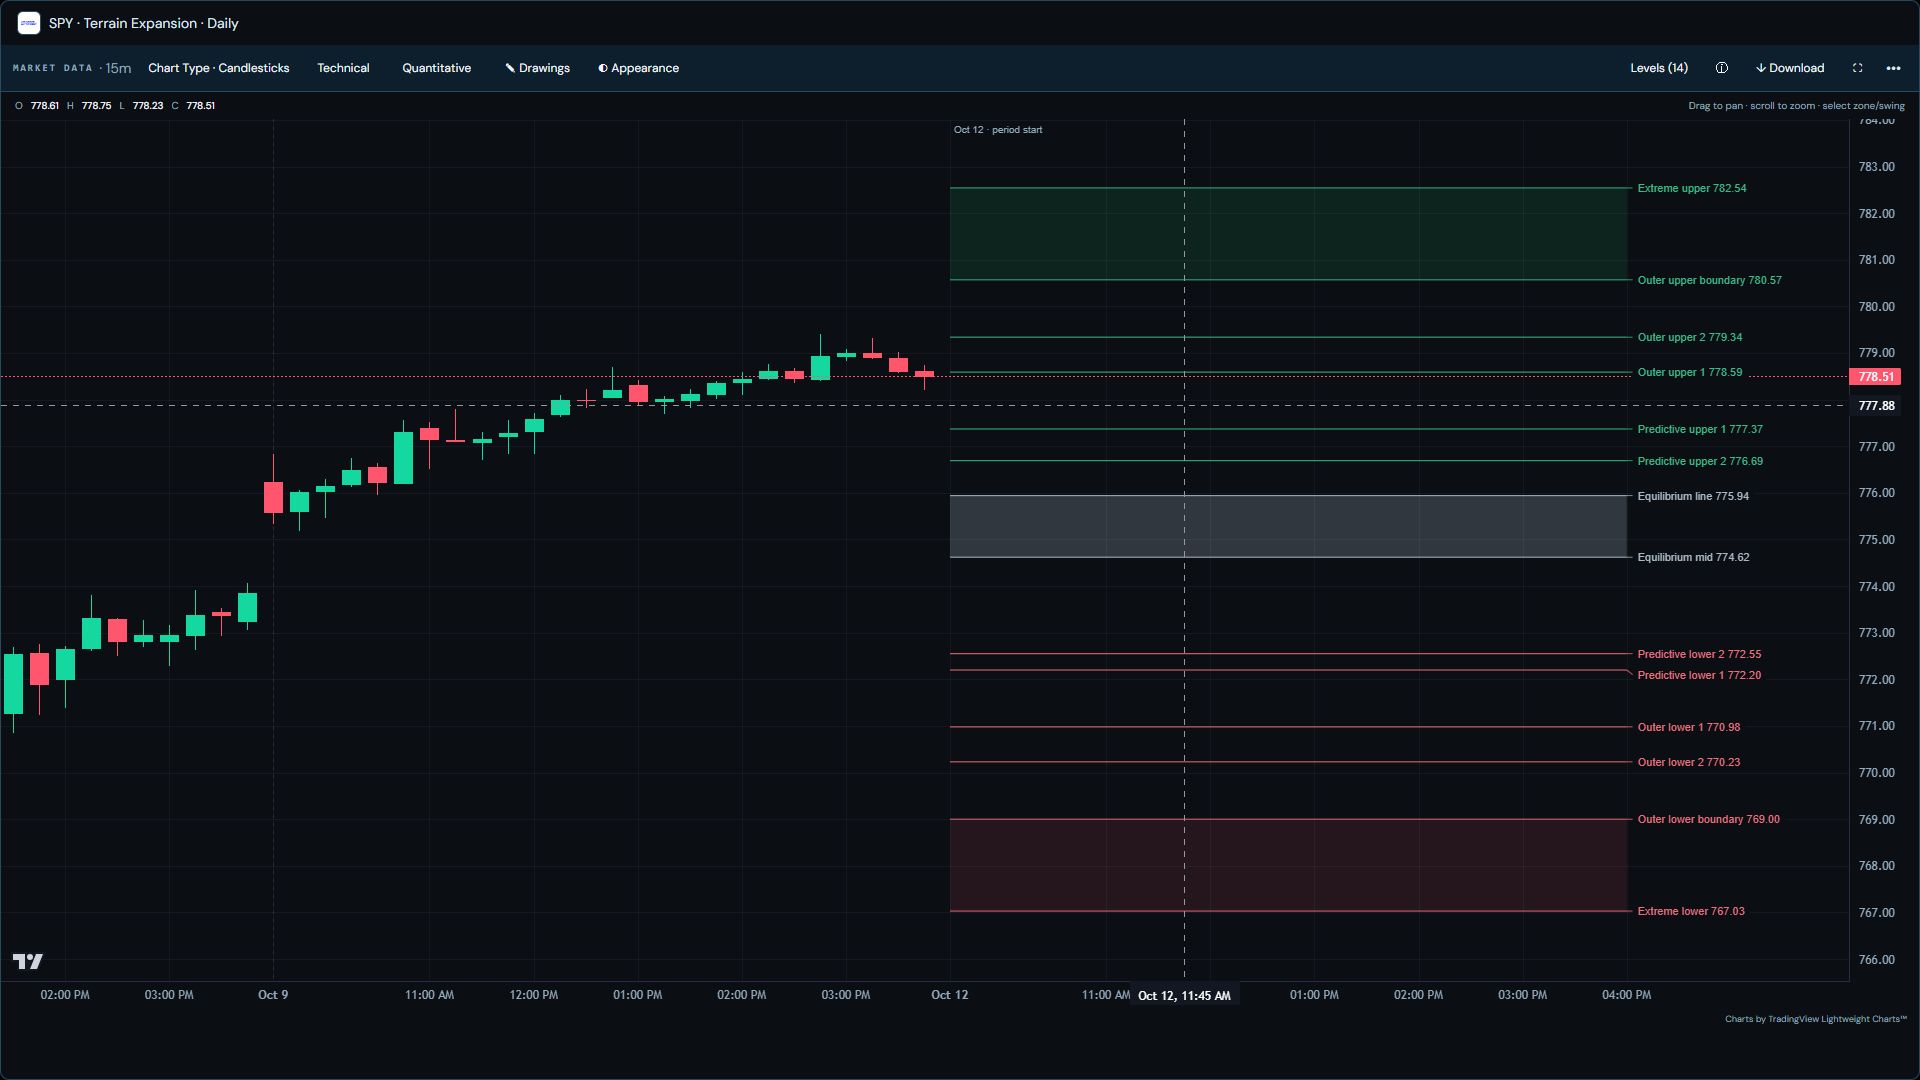
Choose an instrument and a forecast horizon, then read observed candles against the model structure. Terrain Core shows the native published session structure, Terrain Expansion shows wider extensions, and Terrain Vector adds denser intermediate levels. They are alternative views of the same framework, not competing forecasts.
Open Terrain Expansion in Workbench ↗
Ranges and equilibrium
Upper and lower forecast levels and the equilibrium reference are overlaid on the same chart as observed candles. Candle interval and forecast horizon are separate controls.
Horizons
Each horizon is published independently. A daily reading does not describe a monthly or half-year horizon, so compare like-for-like readings.
Levels and Key Levels
Open the full level ladder for distances from price, source dates and horizon alignment, alongside the chart itself.
Test a reading
against scenarios.
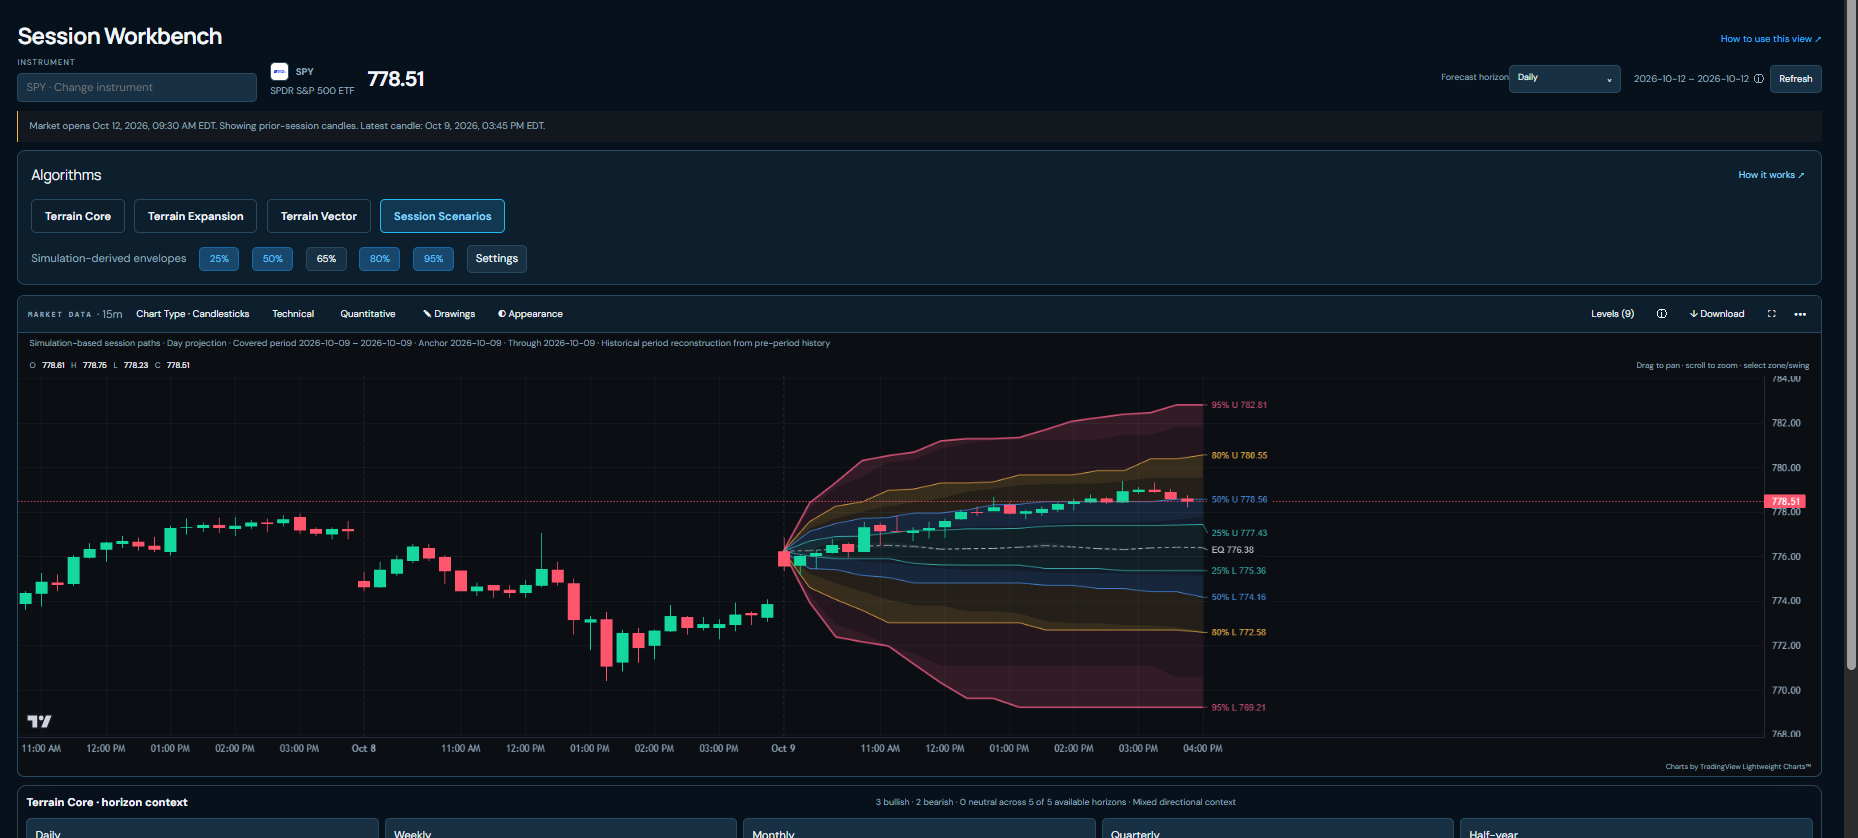
Session Scenarios shows simulation-derived envelopes around a central reference, so you can see how a conditional range could develop through a session. Compare it with the published structure, then add chart studies to inspect the same chart in more detail.
Open Session Scenarios in Workbench ↗
Envelope bands
Toggle the range bands and read them beside observed candles. This capture shows a historical period reconstruction, not a live forecast.
Chart research
Key Levels, EMA, VWAP, market structure and Fibonacci studies sit on the same chart as the model output.
Compare
Switch instruments, horizons and algorithms without losing the chart context, and check the forecast period against the candle dates.
See it in the workspace.
The public sample shows these views without an account. The private workspace shows available market data and coverage status. Forecasts and scenarios are conditional estimates, not guarantees or investment advice.