01 / LEVELS
Three horizons, one context
Read Daily, Weekly, and Monthly states side by side, then compare their equilibrium references on the chart.
Bring Daily, Weekly, and Monthly levels into one view. Compare horizon alignment and view index forecasts directly on licensed candlesticks where supported.
Explore SessionTerrain ↗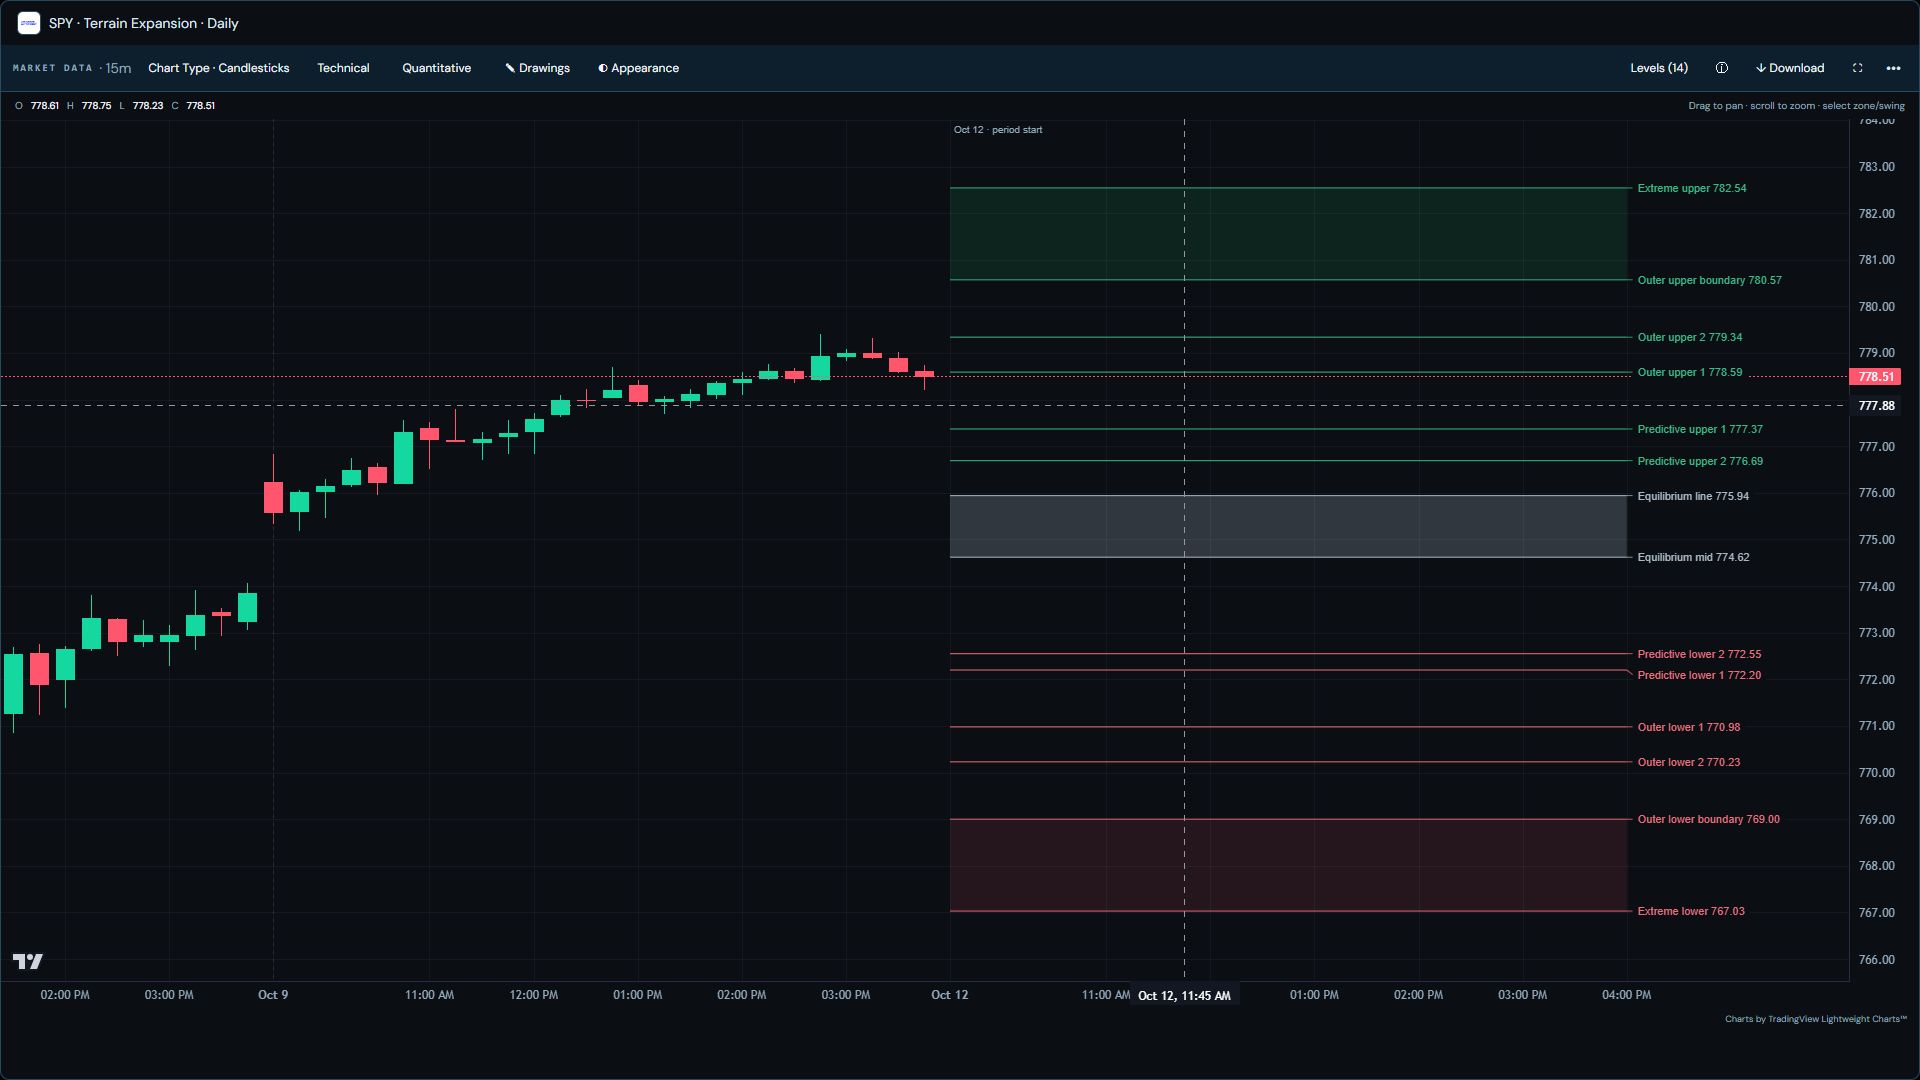
Read Daily, Weekly, and Monthly states side by side, then compare their equilibrium references on the chart.
Inspect predictive ranges, outer levels and the equilibrium zone. Read them directly on the candlestick chart. Switch instruments without losing your context.
Open the complete price ladder, distances from observed price, source dates, and horizon alignment.
Intraday is a shorter-bar view of reference levels, not a newly invented intraday forecasting model. Licensed candles cover the verified existing ETF references; unsupported cash indexes retain clearly labelled forecast maps.
US market forecasts, observed candles and leadership histories have separate update cycles. Every workspace shows its source context.
Read the methodology ↗